The Live Event Dashboard: What Organizers Should Watch During the Event
The Live Event Dashboard: What Organizers Should Watch During the Event
The day of the event is when most organizers stop using their event platform. They are running floors, managing speakers, putting out fires. The platform becomes a thing the audience uses while the organizer team uses radios.
That is a missed signal. Day-of is exactly when a live dashboard pays for itself — if it shows the right things.
The Problem
A live dashboard that just shows attendance numbers is not a dashboard. It is a counter. The organizer already knows attendance is high; they can see the queue at the entrance.
The questions a live dashboard should answer are different:
- Which sessions are filling, which are empty?
- Which exhibitors are being recommended but not visited?
- Which hosted buyers are not getting their pre-booked meetings?
- Which sponsor visibility moments are landing, which are not?
- Where is the floor traffic going right now?
If the platform cannot answer those, the organizer is making decisions blind during the most important hours of the year.
Organizational Risk
An organizer team operating without a live dashboard during the event misses three things:
- Real-time correction. A session with low attendance can be promoted in the next push. An exhibitor with low traffic can be added to the next recommendation slot. None of this is possible if the data is not visible.
- Sponsor service. Sponsors who paid for visibility expect to see how their visibility is performing. Day-of is when they ask. "We will get you numbers next week" is not the answer they bought.
- Post-event credibility. A report written from numbers the organizer never looked at during the event reads as a forensic document. A report written on top of decisions made during the event reads as a record of operational quality.
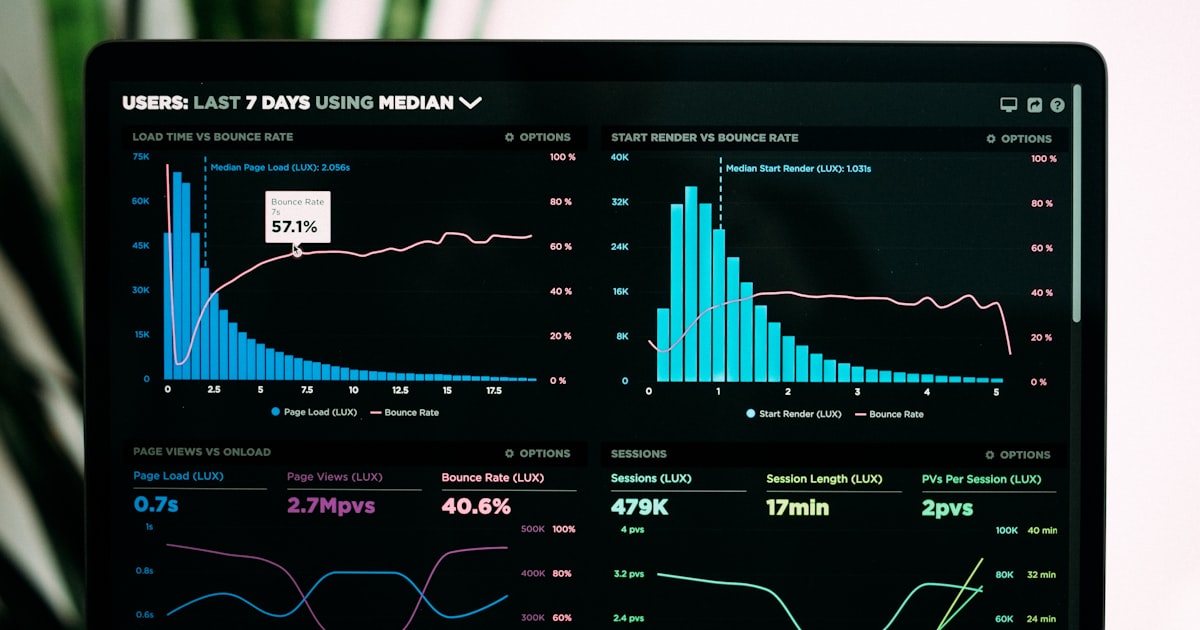
What Eventiqs Shows the Organizer Live
The live dashboard is not a single screen. It is a set of views designed for different roles in the organizer team:
Audience view. Attendance by hour, session fill rates, agenda completion, no-show rates. Helps the program team push attendees toward sessions that need it.
Meeting view. Pipeline volume, acceptance rate, in-progress meetings, meeting room utilization, hosted buyer fulfillment. Helps the matchmaking team intervene where pipelines are weak.
Exhibitor view. Booth recommendation rate, booth visit rate, lead capture volume, lead tier distribution. Helps the exhibitor success team flag participating companies that need on-floor support.
Sponsor view. Sponsored visibility impressions, click-through, attributed meetings, attributed leads, segment reach. Helps the sponsor team service the sponsor in real time, not a week after.
Engagement view. Push notification open rates, app session length, recommendation click-through. Helps the marketing team adjust the cadence of communication during the event.
The dashboard is segmented by role because the organizer team is segmented by role. A single "everything" view does not get used.
A Practical Checklist
Use this list when you set up your live dashboard for the next edition:
- The dashboard is up before doors open. The first hour is when correction is most useful.
- Each role on the organizer team has a view designed for their decisions, not a generic dump.
- Metrics are time-bucketed (last 15 minutes, last hour, day-to-date) so you can see what changed.
- Sponsor metrics are accessible to the sponsor success team in real time, not exported.
- Push notifications and recommendation tweaks can be triggered from the dashboard, not from a separate tool.
- At end-of-day, the team sits with the dashboard for fifteen minutes and adjusts day-two communication.
How the Live Dashboard Carries to the Next Edition
The dashboard is not just an operational tool; it is a record. Every decision made on top of dashboard data is a data point for next edition:
- Sessions that filled get earlier promotion next year.
- Recommendation slots that under-performed get reweighted.
- Sponsor segments that underdelivered get repackaged before renewal.
- Communication pushes that worked become the template cadence for next year.
EMITT 2026's organizer team operated on top of a live view of 3,500+ planned meetings, 600 participating companies, and 28,000+ visitors — adjusting visibility, communication and matchmaking emphasis during the event. The next edition does not start cold; it starts with a year of recorded operational decisions.
Closing the Loop
A live dashboard is not a status screen. It is a real-time decision interface for the organizer team. If the platform shows you what is happening, you can act. If it does not, you read about it next week.